Los Angeles International overtook Chicago O’Hare airport for passenger numbers in 2023, new data on the 100 busiest airports in the US has revealed.

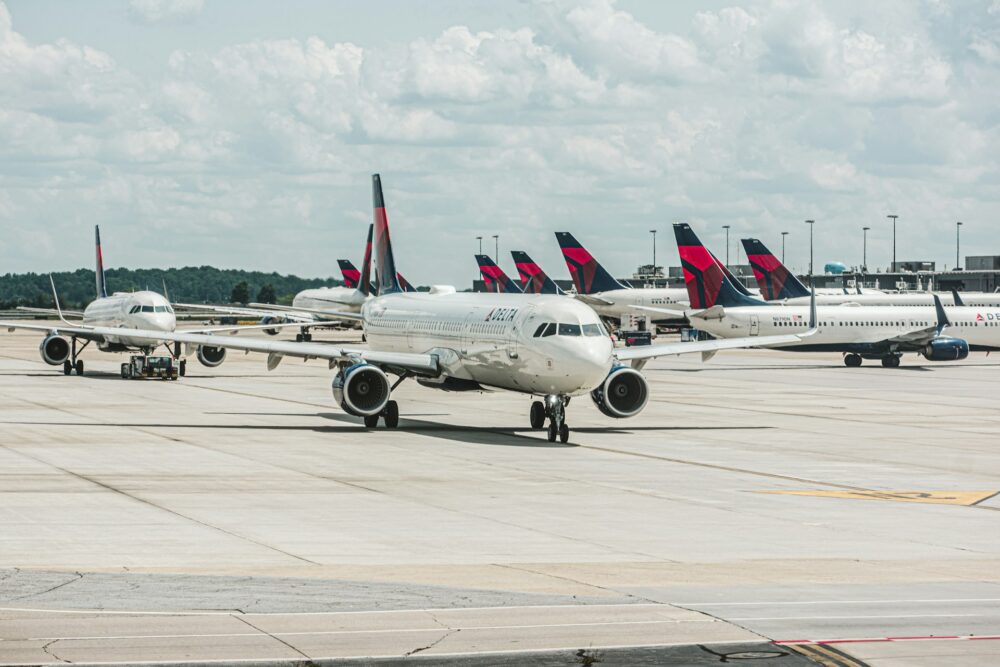
Atlanta Airport (Photo: Lukas Souza via Unsplash)
According to data compiled by the Federal Aviation Administration, LAX replaced Chicago O’Hare in fourth place, despite passenger numbers at both airports increasing significantly compared with 2022. In total, 36.6 million passengers passed through LA International Airport in 2023 compared with 32.3m in 2022 – a jump of over 13% . At O’Hare airport, 33.1m passed through in 2023, compared with 35.8m in 2022 – a rise of over 8%.
Atlanta International Airport continued to rank as the busiest airport in the US with 50.9m passengers – an increase of over 12% on 2022. Second and third place also remained unchanged, occupied once more by Dallas-Fort Worth (39.2m) and Denver Airport (37.8m), respectively.
Strong growth between 2022 and 2023 was seen at Westchester County Airport (+26%) and Asheville Regional Airport (+22%), both of which moved into the top 100 busiest airports. The biggest drop, meanwhile, was seen at Kahului Airport, which moved out of the top 50 in 2023 following a reduction in passenger numbers of almost 9% compared with the previous year.
Notable changes in the rankings in recent years include San Francisco International, which back in 2019 was the 7th busiest airport in the US. However, in 2023, it had dropped to the 13th busiest, with over 3.5m fewer passengers compared with four years previous. The fastest growing airport since 2019 was Sarasota Bradenton International, where traffic more than doubled to 2.14m – moving it up to position 69 from position 97.
Overall, however, traffic at the 20 busiest airports in 2023 was still shown to be down by about 3% compared with 2019 (pre-Covid), according to the data.
Below is a list of the 100 busiest airports in the US in 2023 according to data from the Federal Aviation Administration. A comparison with passenger numbers for 2022 is shown in brackets.
1. Atlanta ATL 50.95 million (+12%)
2. Fort Worth DFW 39.25 million (+11%)
3. Denver DEN 37.86 million (+12%)
4. Los Angeles LAX 36.68 million (+13%)
5. Chicago ORD 35.84 million (+8%)
6. New York City JFK 30.49 million (+12%)
7. Orlando MCO 28.03 million (+15%)
8. Las Vegas LAS 27.90 million (+9%)
9. Charlotte CLT 25.90 million (+12%)
10. Miami MIA 24.72 million (+3%)
11. Seattle SEA 24.59 million (+11%)
12. Newark EWR 24.51 million (+13%)
13. San Francisco SFO 24.19 million (+19%)
14. Phoenix PHX 23.88 million (+9%)
15. Houston IAH 22.23 million (+12%)
16. Boston BOS 19.96 million (+14%)
17. Fort Lauderdale FLL 17.04 million (+11%)
18. Minneapolis MSP 17.02 million (+12%)
19. New York City LGA 16.17 million (+13%)
20. Detroit DTW 15.38 million (+12%)
21. Philadelphia PHL 13.66 (+10%)
22. Salt Lake City SLC 12.91 million (+4%)
23. Baltimore BWI 12.85 million (+15%)
24. Washington DCA 12.37 million (+7%)
25. San Diego SAN 12.19 million (+19%)
26. Washington IAD 12.07 million (+18%)
27. Tampa TPA 11.68 million (+11%)
28. Nashville BNA 11.23 million (+14%)
29. Austin AUS 10.83 million (+4%)
30. Chicago MDW 10.66 million (+10%)
31. Honolulu HNL 10.15 million (+15%)
32. Dallas DAL 8.56 million (+9%)
33. Portland PDX 8.12 million (+12%)
34. St. Louis STL 7.31 million (+9%)
35. Raleigh RDU 7.19 million (+22%)
36. Houston HOU 6.80 million (+15%)
37. Sacramento SMF 6.37 million (+5%)
38. New Orleans MSY 6.31 million (+6%)
39. San Jose SJC 5.96 million (+7%)
40. San Juan SJU 5.96 million (+18%)
41. Santa Ana SNA 5.71 million (+3%)
42. Kansas City MCI 5.65 million (+18%)
43. Oakland OAK 5.52 million (+0%)
44. San Antonio SAT 5.34 million (+12%)
45. Fort Myers RSW 4.96 million (-3%)
46. Cleveland CLE 4.83 million (+13%)
47. Indianapolis IND 4.79 million (+14%)
48. Pitttsburgh PIT 4.49 million (+15%)
49. Cincinnati CVG 4.29 million (+16%)
50. Columbus CMH 4.10 million (+13%)
51. Palm Beach PBI 3.81 million (+17%)
52. Kahului OGG 3.75 million (-9%)
53. Jacksonville JAX 3.62 million (+14%)
54. Ontario ONT 3.18 million (+12%)
55. Burbank BUR 3.13 million (+2%)
56. Bradley BDL 3.12 million (+10%)
57. Charleston CHS 3.00 million (+16%)
58. Milwaukee MKE 2.93 million (+10%)
59. Anchorage ANC 2.68 million (+3%)
60. Albuquerque ABQ 2.60 million (+12%)
61. Omama OMA 2.46 million (+12%)
62. Memphis MEM 2.40 million (+11%)
63. Richmond RIC 2.40 million (+17%)
64. Boise BOI 2.37 million (+6%)
65. Norfolk ORF 2.31 million (+12%)
66. Buffalo BUF 2.29 million (+14%)
67. Louisville SDF 2.27 million (+20%)
68. Reno RNO 2.25 million (+6%)
69. Sarasota SRQ 2.14 million (+12%)
70. Oklahoma City OKC 2.14 million (+11%)
71. Kailua KOA 2.10 million (+5%)
72. El Paso ELP 2.02 million (+5%)
73. Spokane GEG 2.00 million (+5%)
74. Tucson TUS 1.93 million (+13%)
75. Savannah SAV 1.91 million (+11%)
76. Grand Rapids GRR 1.90 million (+11%)
77. Long Beach LGB 1.84 million (+15%
78. Lihue LIH 1.81 million (+1%)
79. Warwick PVD 1.73 million (+10%)
80. Myrtle Beach MYR 1.66 million (-3%)
81. Palm Springs PSP 1.62 million (+8%)
82. Tulsa TUL 1.57 million (+9%)
83. Des Moines DSM 1.52 million (+11%)
84. Birmingham BHM 1.50 million (+13%)
85. Sanford SFB 1.45 million (+6%)
86. Syracuse SYR 1.41 million (+13%)
87. Knoxville TYS 1.38 million (+14%)
88. Albany ALB 1.38 million (+8%)
89. Pensacola PNS 1.37 million (+13%)
90. Rochester ROC 1.33 million (+15%)
91. Greenville GSP 1.26 million (+18%)
92. Clearwater PIE 1.25 million (+2%)
93. Bozeman BZN 1.23 million (+8%)
94. Fresno FAT 1.20 million (+12%)
95. Colorado Springs COS 1.20 million (+10%)
96. Westchester HPN 1.16 million (+26%)
97. Asheville AVL 1.13 million (+22%)
98. Destin VPS 1.12 million (+13%)
99. Portland PWM 1.11 million (+13%)
100. Little Rock LIT 1.10 million (+12%)